top of page

Create account
+91 96113 44773


Search
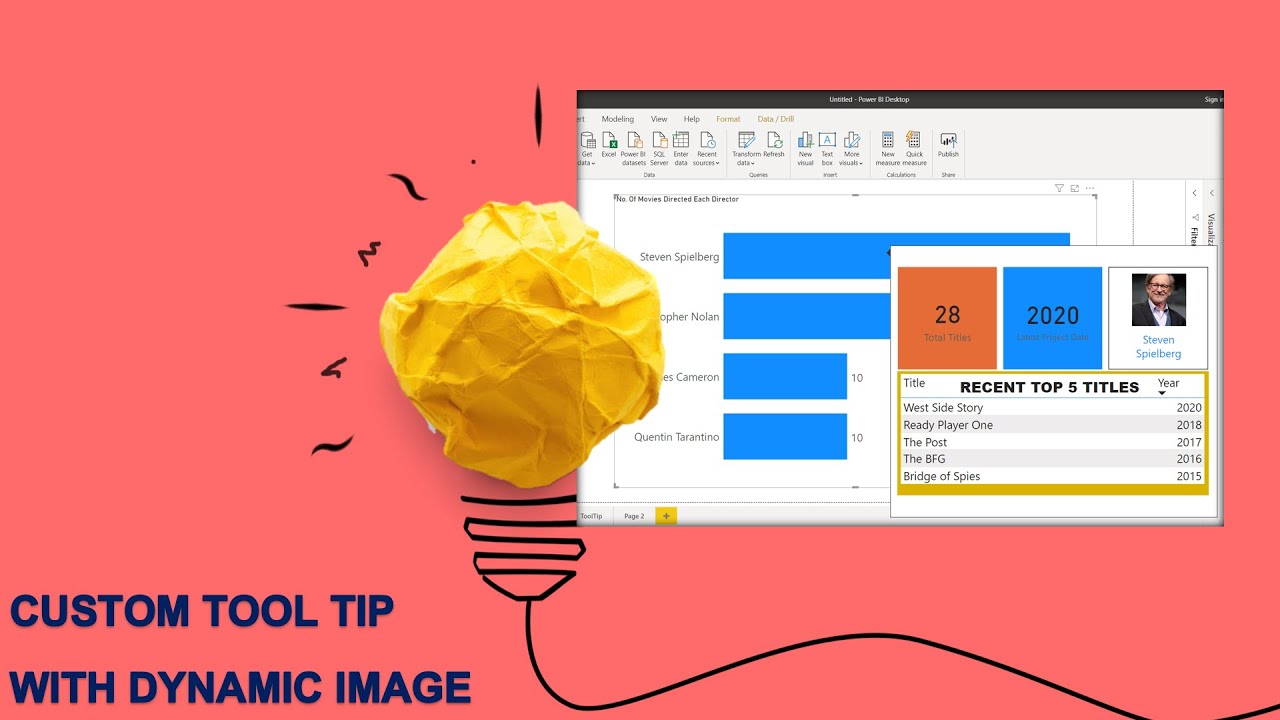
How to Create Custom Tool Tip with Dynamic Image
While visualizing data in Power BI Report if you wish to have any picture which is relevant to data with a filter context in the Visual (...

Vijay Perepa
Aug 26, 20201 min read


How to Create Animated SUNBURST CHART
A Sunburst Chart is used to visualize hierarchical data, depicted by Multiple Donut Chart Layers. The circle in the center represents the...
Vijay Perepa
Aug 26, 20201 min read


How to create Dynamic Date Table in Power BI
A Common Question by many Power Beginners that how to have a Fiscal Quarter and Fiscal Year Fields on the basis of Fiscal Calendar in...
Vijay Perepa
Aug 26, 20201 min read

Power BI Sample Report
We are providing a free sample to all our registered members to access and download and try, shortly. A Complete report showing...
Vijay Perepa
Aug 25, 20201 min read
How to create Complete Excel Dash Board in 15 minutes
Why you use Excel? The answer from many Excel users is - "We create Reports / Dashboards" But the creation of reports by using Formulae...
Vijay Perepa
Aug 24, 20201 min read

Understanding Power Query Editor - using Pivot / UnPivot / Transpose and many more techniques.....
Power Query Editor (PQE) is a best tool available in Excel / Power BI / SSAS (SQL Server Analysis Services). PQE performs the ETL...
Vijay Perepa
Aug 23, 20201 min read


Importing PDF Data to Power BI / Excel
Some times you need to deal with Data in PDF Files. And you can't compute data within PDF, so you need to take that Data into Excel /...
Vijay Perepa
Aug 21, 20201 min read
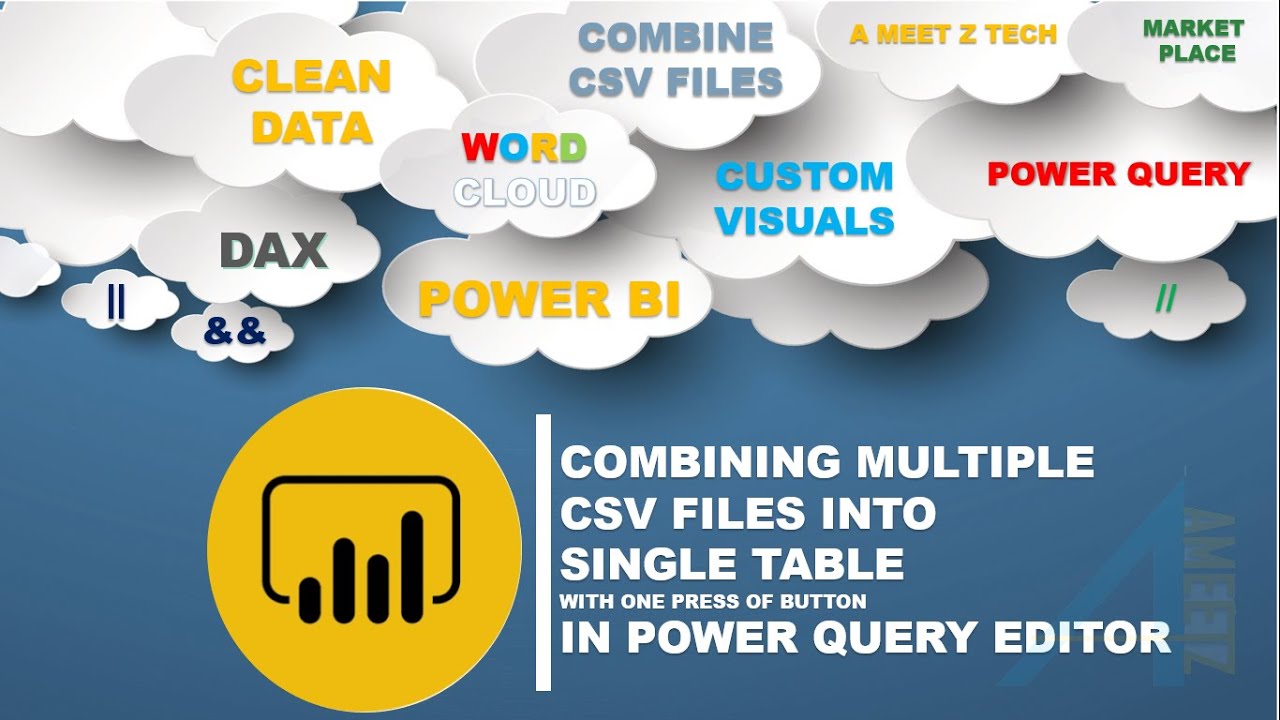
Combining Files in a Folder to a Single Table in Power Query Editor ( Power BI / Excel)
Learn a simple trick to combine many CSV Files in a folder to a single Query Table in Power Query Editor. In Power BI / Excel, you can...
Vijay Perepa
Aug 20, 20201 min read

Compare Excel Power BI Functions
A most common Question I face from many Participants during my Training programs that , is there a possibility to compare Excel and Power...
Vijay Perepa
Aug 16, 20201 min read


Comparing First Fortnight Revenue with 2nd Fortnight revenue (Day to Day) in a Month using DAX!
The question posted in community.powerbi.com Is there a SAMEPERIOD LAST DAY equivalent in DAX? Hence August 1st to 15th versus July 1st...
Vijay Perepa
Aug 15, 20201 min read

Hide or Un-hide sheets based on selection using VBA in Excel: A Most common question Asked in in VBA
This is a most common question asked across the Groups. How to Hide or Un-hide Sheets based on Selection. There are two ways One, by...
Vijay Perepa
Aug 14, 20201 min read


How to Create A Complete PowerPoint Deck - Direct from Excel Dashboard with Few Buttons (Macros)
Creating PowerPoint is one big task while preparing for any Special events like Monthly/Quarterly Business Performance Meetings! It is my...
Vijay Perepa
Aug 12, 20201 min read


Do you wish to Learn M Language (MQuery)?
Microsoft Power Query provides a powerful data import and cleansing process experience While working with Power Query in Excel and Power...
Vijay Perepa
Aug 11, 20201 min read

How to Import Data from Google Sheets to Excel / Power BI
Many times I have seen a question in many forums, how to Get Data from Google Sheets Interestingly , the process is quite simple and you...
Vijay Perepa
Aug 9, 20201 min read

Conditional Formatting in Power BI - Part 1
When you are developing a report in Power BI, you always need special effects to make your report much interesting and readable and also...
Vijay Perepa
Aug 9, 20201 min read
Vijay Perepa
Jul 30, 20200 min read
Vijay Perepa
Jul 30, 20200 min read
Vijay Perepa
Jul 30, 20200 min read
bottom of page