top of page

Create account
+91 96113 44773
Search

𝐂𝐮𝐬𝐭𝐨𝐦 𝐕𝐢𝐬𝐮𝐚𝐥𝐬 𝐰𝐢𝐭𝐡 𝐏𝐲𝐭𝐡𝐨𝐧 𝐢𝐧 𝐏𝐨𝐰𝐞𝐫 𝐁𝐈
ʟᴇᴀʀɴ ᴠᴀʀɪᴏᴜꜱ ᴇʟᴇᴍᴇɴᴛꜱ ᴏꜰ ᴄʜᴀʀᴛꜱ ɪɴ ᴘᴏᴡᴇʀ ʙɪ ᴀɴᴅ ᴘʏᴛʜᴏɴ While using a reporting Tool, some times the Customer requirements are tricky and...

Vijay Perepa
Apr 11, 20211 min read

Vijay Perepa
Apr 8, 20210 min read
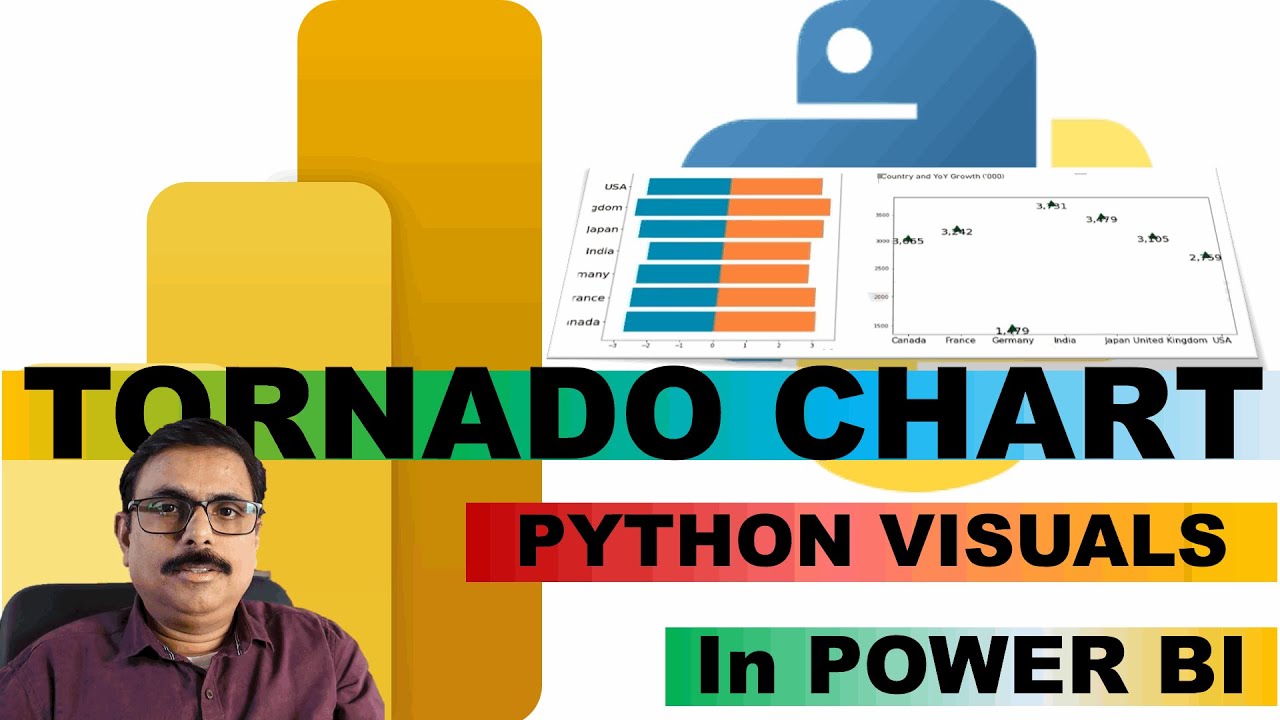
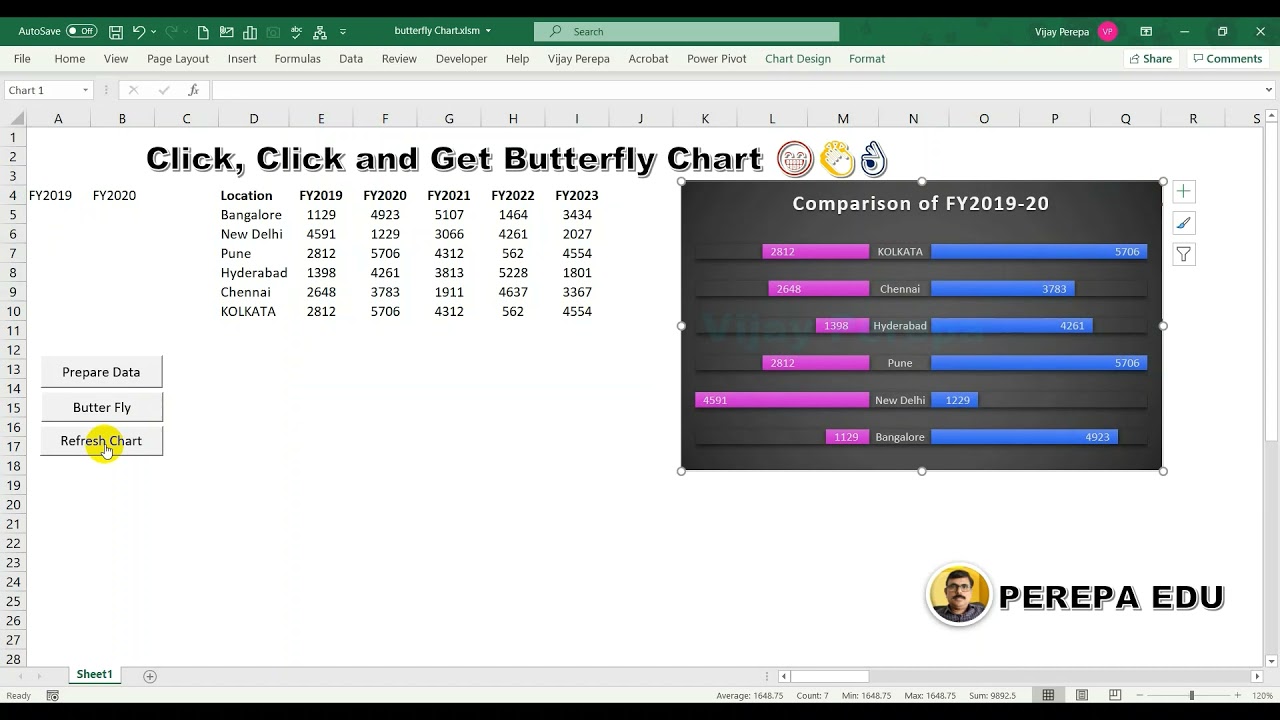
𝗣𝗼𝘄𝗲𝗿 𝗕𝗜 𝗮𝗻𝗱 𝗣𝘆𝘁𝗵𝗼𝗻 𝗜𝗻𝘁𝗲𝗴𝗿𝗮𝘁𝗶𝗼𝗻 - 𝗧𝗼𝗿𝗻𝗮𝗱𝗼 𝗖𝗵𝗮𝗿𝘁
𝗣𝗼𝘄𝗲𝗿 𝗕𝗜 𝗮𝗻𝗱 𝗣𝘆𝘁𝗵𝗼𝗻 𝗜𝗻𝘁𝗲𝗴𝗿𝗮𝘁𝗶𝗼𝗻 - 𝗣𝘆𝘁𝗵𝗼𝗻 𝗩𝗶𝘀𝘂𝗮𝗹𝘀 𝗶𝗻 𝗣𝗼𝘄𝗲𝗿 𝗕𝗜 - 𝗧𝗼𝗿𝗻𝗮𝗱𝗼 𝗖𝗵𝗮𝗿𝘁...
Vijay Perepa
Apr 7, 20211 min read
𝗣𝗼𝘄𝗲𝗿 𝗕𝗜 - 𝗖𝗮𝗹𝗰𝘂𝗹𝗮𝘁𝗲 𝗖𝗔𝗚𝗥 (𝗖𝗼𝗺𝗽𝗼𝘂𝗻𝗱 𝗔𝗻𝗻𝘂𝗮𝗹 𝗚𝗿𝗼𝘄𝘁𝗵 𝗥𝗮𝘁𝗲)
CAGR is the rate of return that would be required for an investment to grow from its beginning balance to its ending balance, assuming...
Vijay Perepa
Apr 7, 20211 min read
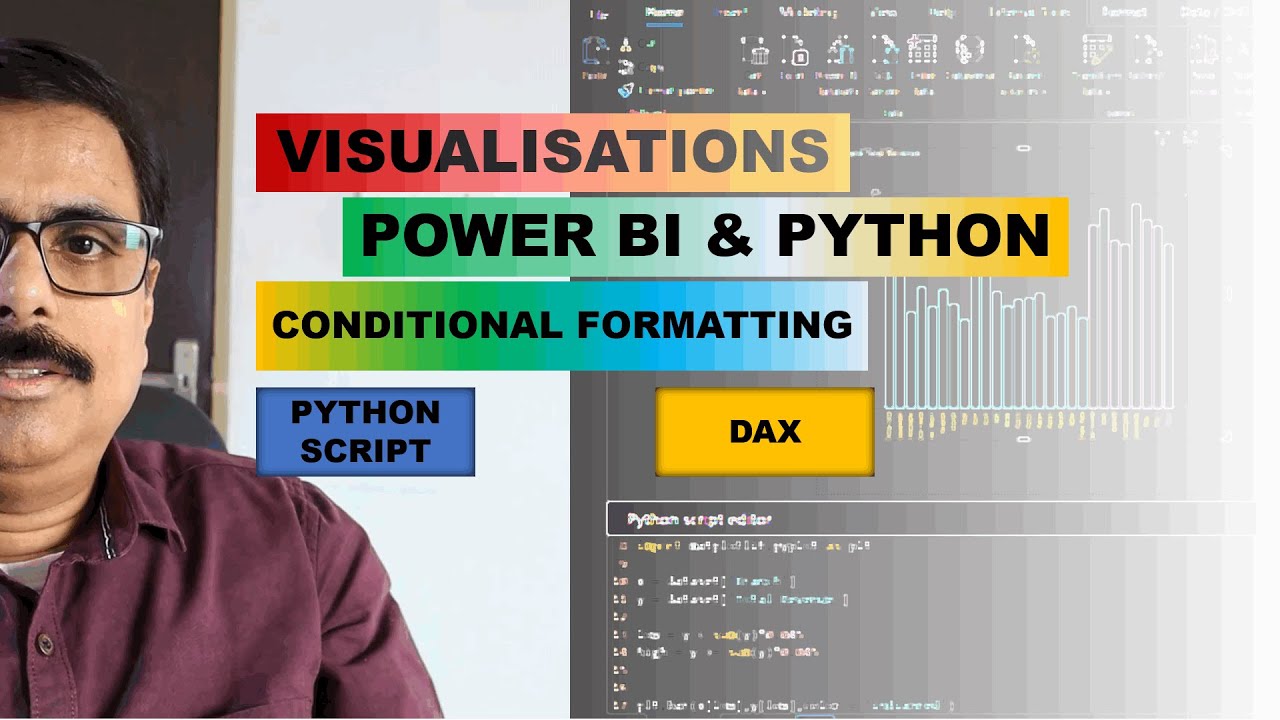
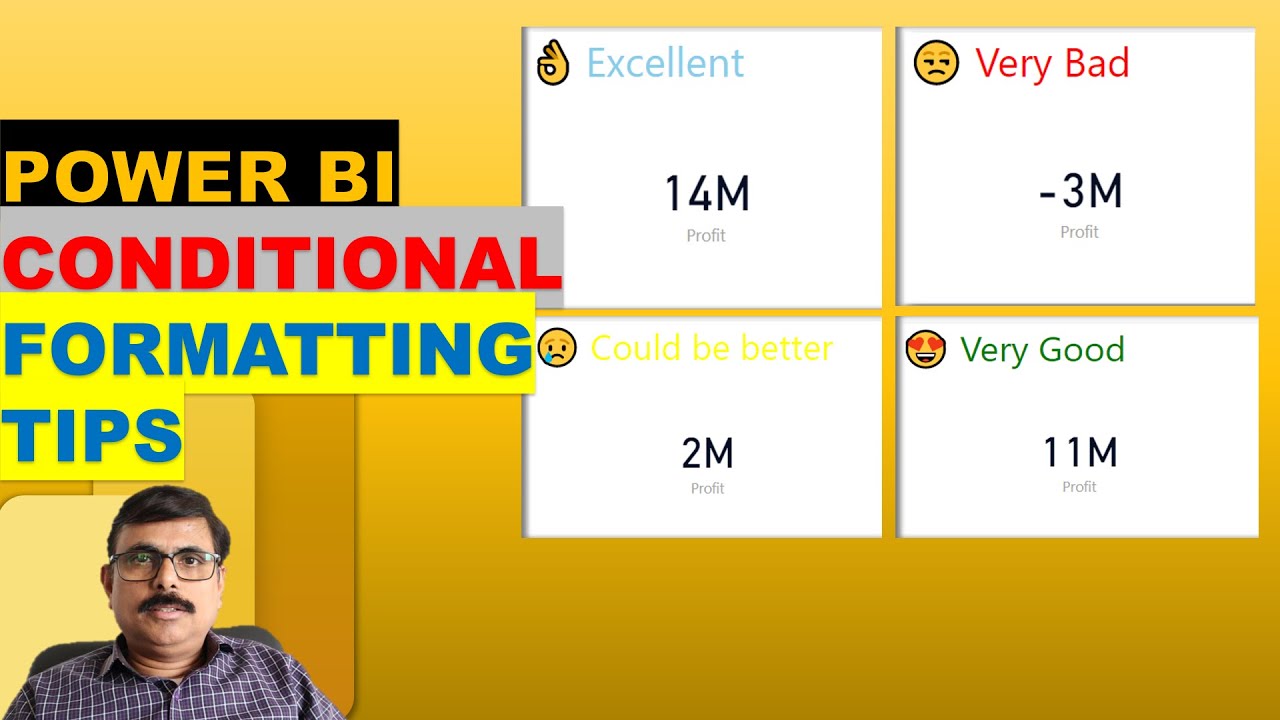
𝐏𝐨𝐰𝐞𝐫 𝐁𝐈, 𝐏𝐲𝐭𝐡𝐨𝐧 𝐈𝐧𝐭𝐞𝐠𝐫𝐚𝐭𝐢𝐨𝐧 - 𝐂𝐨𝐧𝐝𝐢𝐭𝐢𝐨𝐧𝐚𝐥 𝐅𝐨𝐫𝐦𝐚𝐭𝐭𝐢𝐧𝐠
You can run Python scripts directly in Power BI Desktop and import the resulting datasets into a Power BI Desktop data model. To run...
Vijay Perepa
Apr 5, 20211 min read
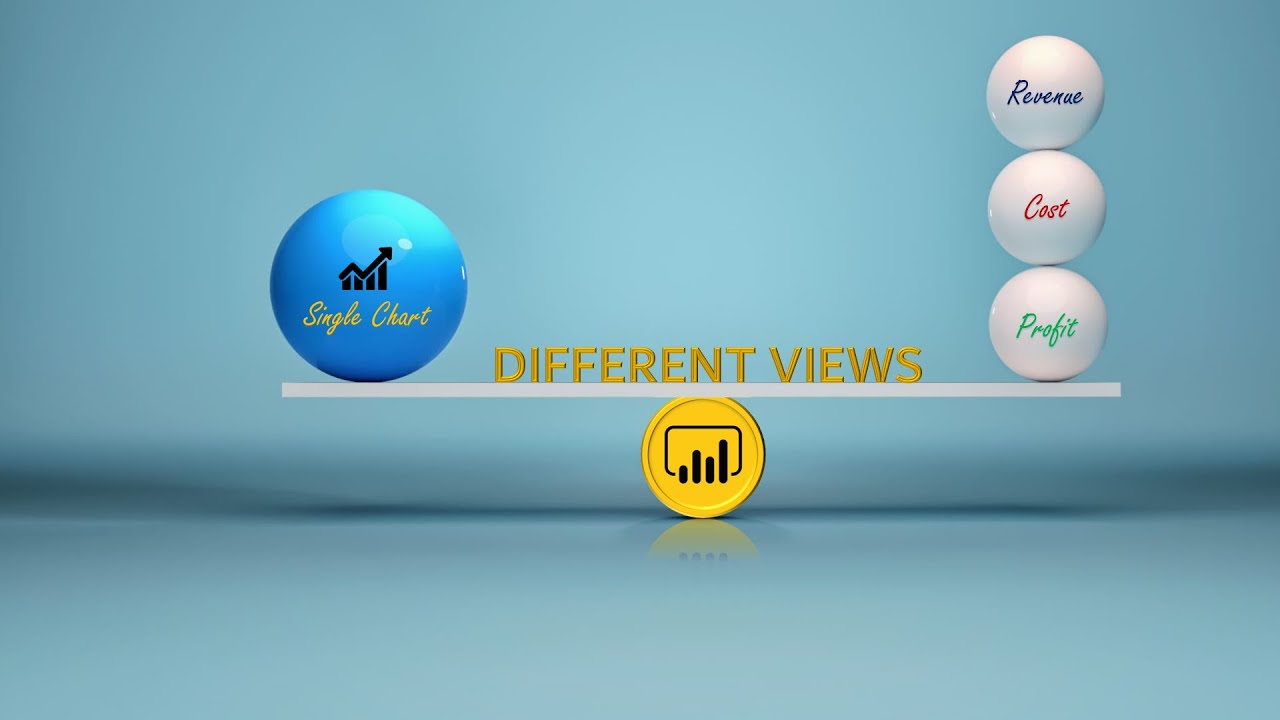
One Visual - Many Views - Based on Selection - Power BI
Effective use of SELECTEDVALUE() Function
Vijay Perepa
Apr 4, 20211 min read
Vijay Perepa
Mar 31, 20210 min read
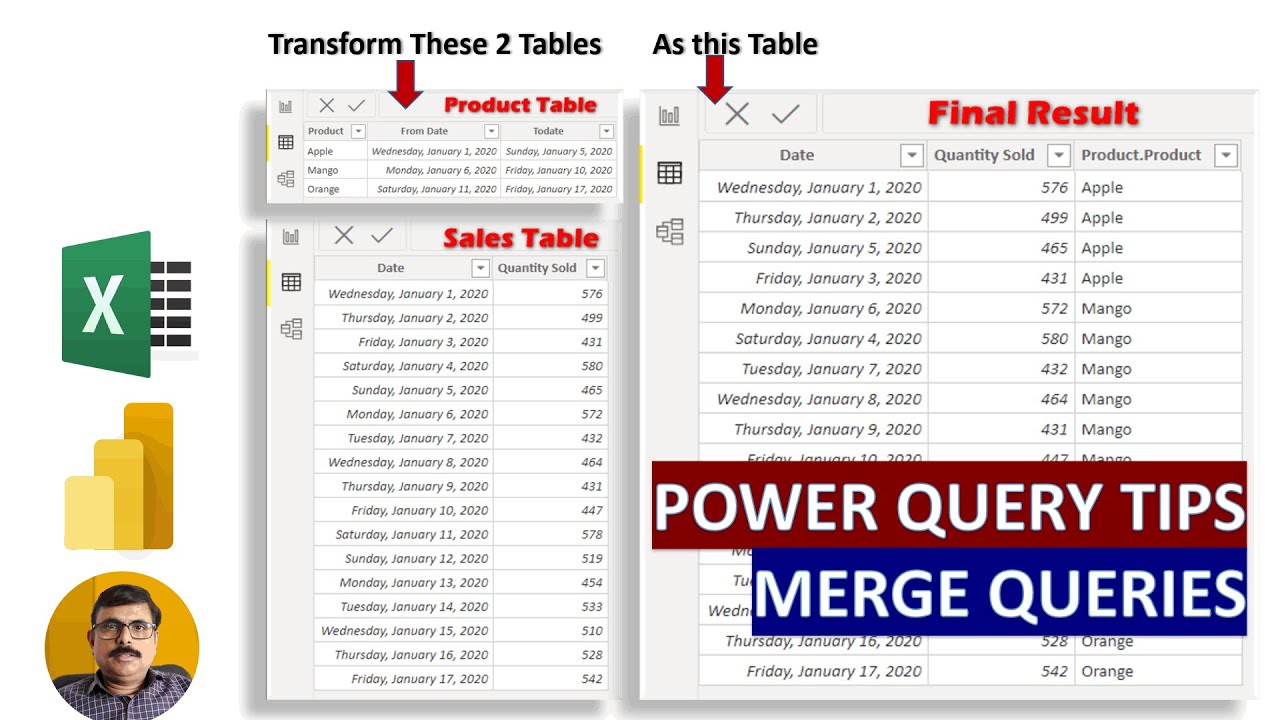
Power Query Editor - Merge Queries - Power BI & Excel
Managing Excel Data is some times bit complicated ! Let me explain a scenario which is a real time scenario from a Student ; The Data...
Vijay Perepa
Mar 29, 20211 min read
Vijay Perepa
Mar 23, 20210 min read

Vijay Perepa
Mar 23, 20210 min read

𝐓𝐢𝐦𝐞 𝐈𝐧𝐭𝐞𝐥𝐥𝐢𝐠𝐞𝐧𝐜𝐞 𝐢𝐧 𝐏𝐨𝐰𝐞𝐫 𝐁𝐈
Time intelligence calculations play very important role while analyzing the data to compare specific periods of current and previous...
Vijay Perepa
Mar 21, 20211 min read


Vijay Perepa
Mar 20, 20210 min read

Create your Own Custom Visuals in Power BI
Tutorial will posted shortly, to get notified Please do SUBSCRIBE
Vijay Perepa
Mar 20, 20211 min read
How to create a complete PPT from Excel with a press of button
Some times creating PowerPoint presentation slide by slide is quite tedious and very demotivating. But If you can get entire (Complete)...
Vijay Perepa
Mar 19, 20211 min read
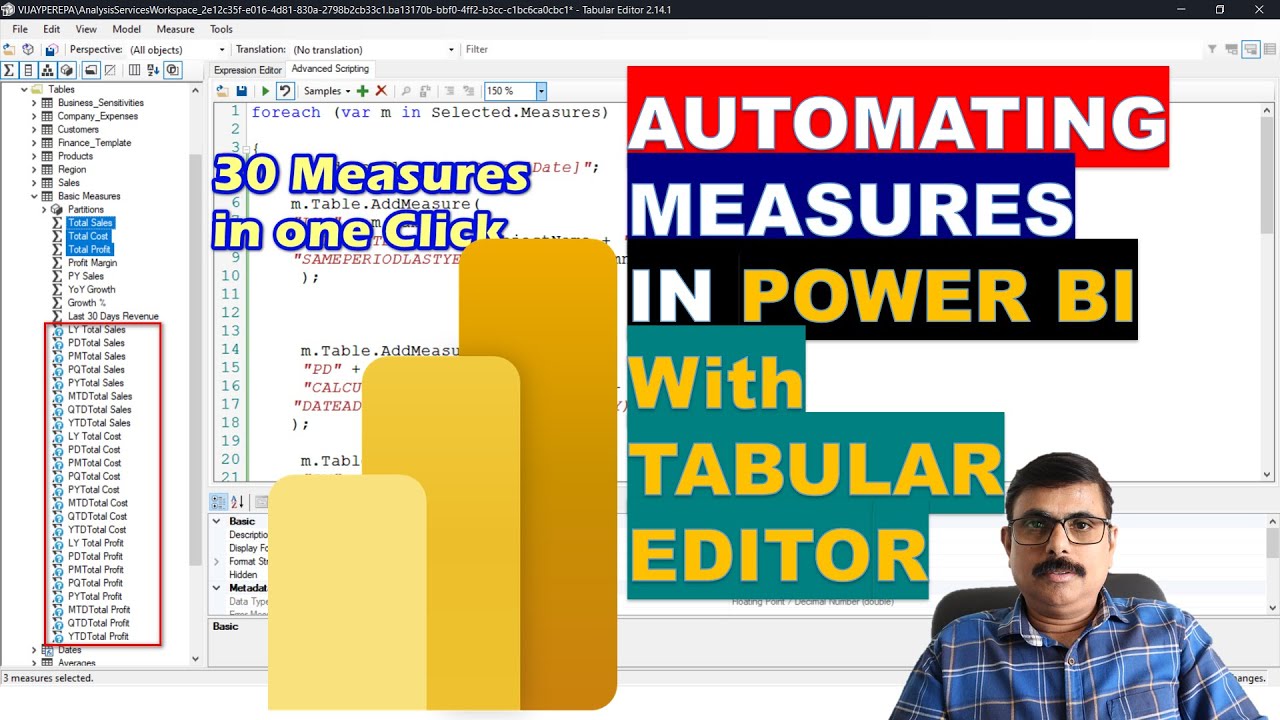
𝐀𝐮𝐭𝐨𝐦𝐚𝐭𝐢𝐧𝐠 𝐌𝐞𝐚𝐬𝐮𝐫𝐞𝐬 𝐢𝐧 𝐏𝐨𝐰𝐞𝐫 𝐁𝐈 𝐰𝐢𝐭𝐡 𝐓𝐚𝐛𝐮𝐥𝐚𝐫 𝐄𝐝𝐢𝐭𝐨𝐫
𝟑𝟎 𝐌𝐞𝐚𝐬𝐮𝐫𝐞𝐬 𝐢𝐧 𝐒𝐢𝐧𝐠𝐥𝐞 𝐂𝐥𝐢𝐜𝐤 😨 While Creating a Power BI Report - DAX Functions matter a lot. We can actually...
Vijay Perepa
Mar 13, 20211 min read
CREATING BULK MEASURES IN POWER BI
Using Tabular Editor
Vijay Perepa
Mar 6, 20211 min read
Creating Multiple Measures using Tabular Editor - Automatic Measures in Power BI
While working in Power BI , Measures play very important role, but some times it becomes tedious to create number of measures. If we can...
Vijay Perepa
Mar 5, 20211 min read
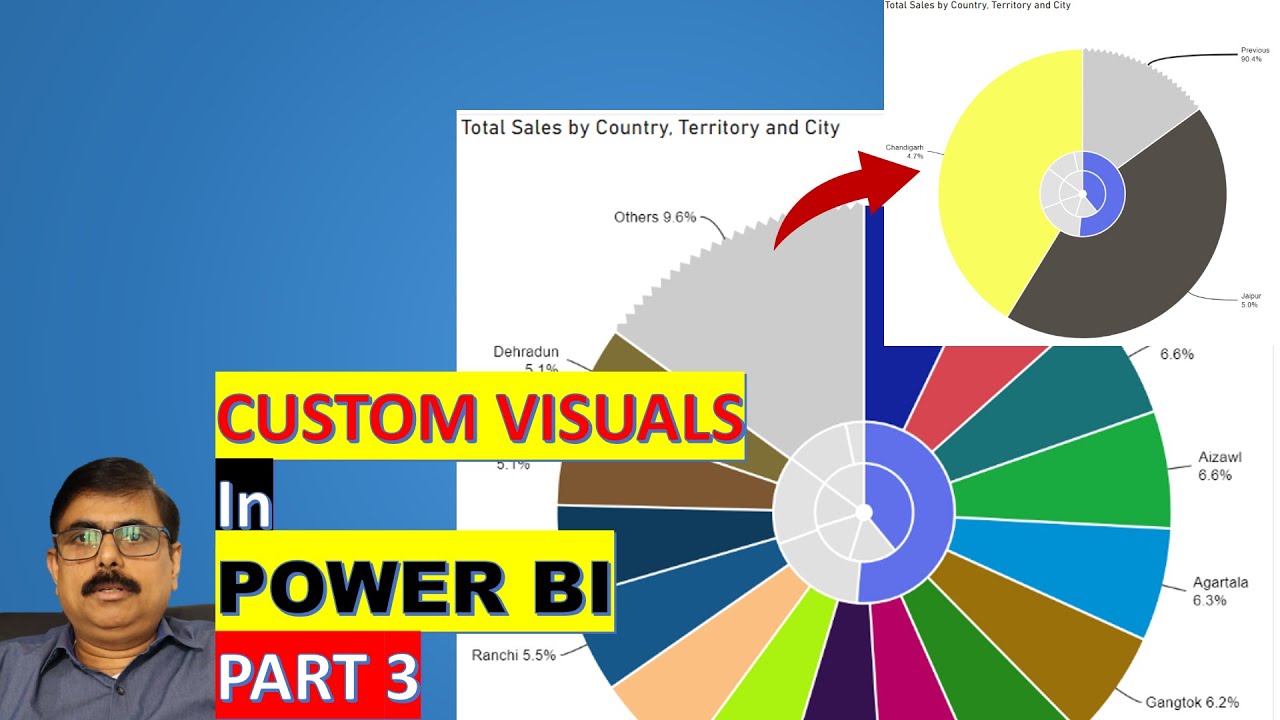
𝐂𝐮𝐬𝐭𝐨𝐦𝐕𝐢𝐬𝐮𝐚𝐥𝐬- 𝐏𝐨𝐰𝐞𝐫 𝐁𝐈 𝐏𝐚𝐫𝐭𝟑 𝐏𝐢𝐞𝐂𝐡𝐚𝐫𝐭 𝐰𝐢𝐭𝐡 𝐃𝐫𝐢𝐥𝐥 𝐃𝐨𝐰𝐧
While using Pie Chart / Donut Chart , we may require TOPN and Others and when filtering Other we need the breakup. In this video I have...
Vijay Perepa
Mar 5, 20211 min read
POWER BI DA-100 Personalized Training
If you wish to Learn Power BI for Your Current Job, Entering a New Job or wanted to attend the Exam for certification, you can reach us...
Vijay Perepa
Feb 21, 20211 min read


Power BI - HR Analytics (Recruitment) - Webinar
This webinar will be conducted between 6:30 PM - 8:00 pm (IST) Click here to Join the session . Be on time
Vijay Perepa
Feb 20, 20211 min read
bottom of page