top of page

Create account
+91 96113 44773
Search
Microsoft Fabric Data Engineering Explained Lakehouse, Spark and OneLake Architecture
Microsoft Fabric Data Engineering Explained Lakehouse, Spark and OneLake Architecture Watch Video 🎥 In this video, we explore Microsoft Fabric Data Engineering in a clear and structured way. You will understand: • Lakehouse architecture and why it combines Data Lake flexibility with Data Warehouse performance • How Apache Spark works inside Fabric • Notebooks and Spark Job Definitions for production workloads • Medallion architecture (Bronze, Silver, Gold) • How OneLake acts

Vijay Perepa
Mar 41 min read


How to Analyze Latest N Months Sales
Watch Video here https://www.youtube.com/watch?v=0sVrr2Hr514&t=219s Analysing Last N Months is an excellent way to get a quick,...
Vijay Perepa
Jul 12, 20251 min read


When to use Funnel Chart
When to use Funnel Chart A 𝒇𝒖𝒏𝒏𝒆𝒍 𝒄𝒉𝒂𝒓𝒕 is designed to visually represent data as it moves through various stages of a...
Vijay Perepa
Apr 7, 20251 min read
𝐌𝐮𝐥𝐭𝐢𝐩𝐥𝐞 𝐃𝐚𝐭𝐞 𝐅𝐨𝐫𝐦𝐚𝐭𝐬 𝐢𝐧 𝐒𝐚𝐦𝐞 𝐂𝐨𝐥𝐮𝐦𝐧 | 𝐏𝐨𝐰𝐞𝐫 𝐐𝐮𝐞𝐫𝐲
👉👉𝐖𝐚𝐭𝐜𝐡 𝐕𝐢𝐝𝐞𝐨 - https://youtu.be/LaNZt_lf-eo 👈👈 In many of my Excel trainings, and this applies to Power BI as well, I’ve...
Vijay Perepa
Feb 13, 20251 min read
𝐃𝐚𝐭𝐚 𝐈𝐧𝐠𝐞𝐬𝐭𝐢𝐨𝐧 𝐭𝐨 𝐃𝐞𝐥𝐭𝐚 𝐓𝐚𝐛𝐥𝐞 𝐰𝐢𝐭𝐡 𝐃𝐚𝐭𝐚𝐟𝐥𝐨𝐰 𝐆𝐞𝐧2 | 𝐒𝐞𝐭 𝐃𝐞𝐟𝐚𝐮𝐥𝐭 𝐒𝐞𝐦𝐚𝐧𝐭𝐢𝐜 𝐌𝐨𝐝𝐞𝐥 & 𝐁𝐮𝐢𝐥𝐝 𝐑𝐞𝐩𝐨𝐫𝐭𝐬 𝐢𝐧 𝐌𝐢𝐜𝐫𝐨𝐬𝐨𝐟𝐭 𝐅𝐚𝐛
👉👉 𝑾𝒂𝒕𝒄𝒉 𝑽𝒊𝒅𝒆𝒐 https://youtu.be/j9rdXD5mAno 👈👈 #PowerBI #DataAnalytics #ETL #Dataflows #PowerQuery #MicrosoftFabric #Busi...
Vijay Perepa
Feb 11, 20251 min read
𝐒𝐕𝐆 𝐀𝐧𝐢𝐦𝐚𝐭𝐢𝐨𝐧𝐬 𝐢𝐧 𝐏𝐨𝐰𝐞𝐫 𝐁𝐈!
👉👉 Watch Video https://youtu.be/e5eZN0uzB3A 👈👈 Are you looking to enhance your Power BI dashboards with interactive and dynamic...
Vijay Perepa
Feb 1, 20251 min read
Create Interactive Flip Cards in Power BI with HTML & CSS!
👉👉 Watch Tutorial - https://lnkd.in/gqi56A_i Learn how to use HTML & CSS to create dynamic and engaging flip cards that display...
Vijay Perepa
Jan 4, 20251 min read


𝐏𝐨𝐰𝐞𝐫 𝐨𝐟 𝐏𝐲𝐭𝐡𝐨𝐧 𝐢𝐧 𝐏𝐨𝐰𝐞𝐫 𝐁𝐈! 🐍
👉👉 𝘞𝘢𝘵𝘤𝘩 𝘵𝘩𝘦 𝘧𝘶𝘭𝘭 𝘵𝘶𝘵𝘰𝘳𝘪𝘢𝘭 𝘩𝘦𝘳𝘦: https://lnkd.in/ggJYPin5 👈👈 I am sharing here my video link where I have...
Vijay Perepa
Jan 2, 20251 min read
Understanding Calculation Groups (CG) in Power BI
Understanding Calculation Groups (CG) in Power BI is a valuable skill that can help you reduce the number of measures you need to create....
Vijay Perepa
May 3, 20241 min read
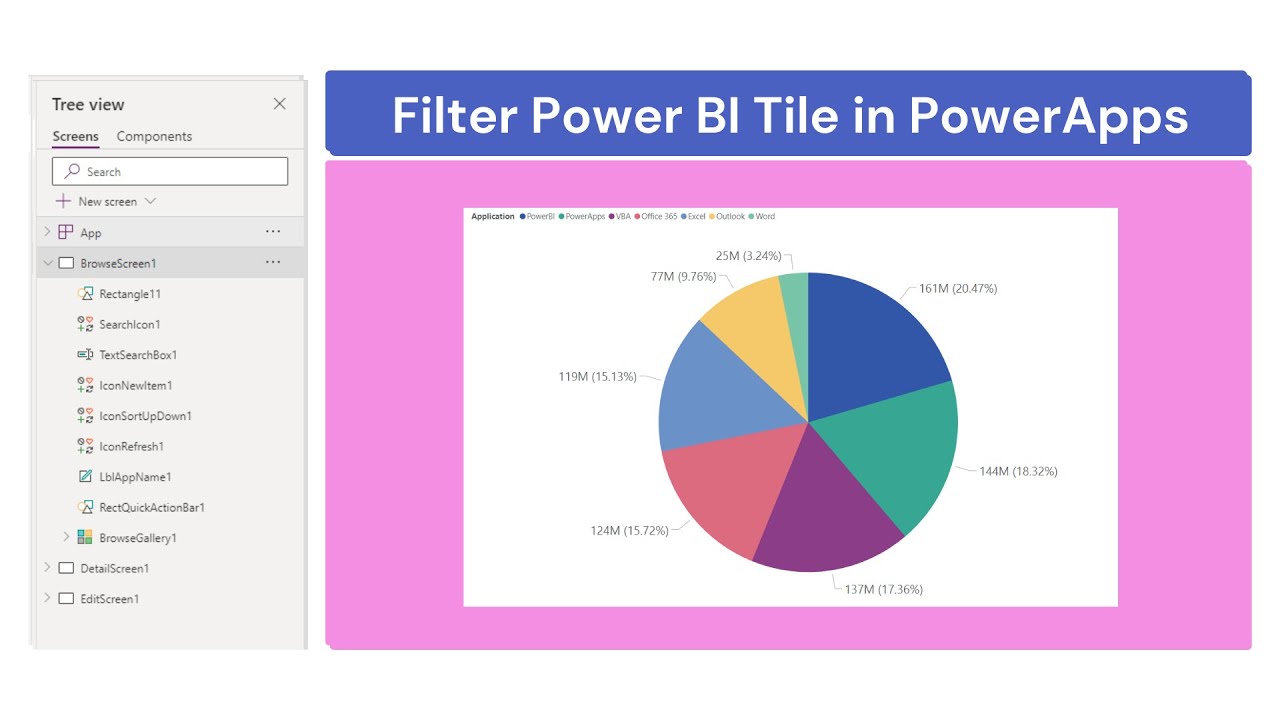
𝐔𝐧𝐥𝐨𝐜𝐤 𝐭𝐡𝐞 𝐌𝐚𝐠𝐢𝐜 𝐨𝐟 𝐏𝐨𝐰𝐞𝐫 𝐁𝐈 𝐚𝐧𝐝 𝐏𝐨𝐰𝐞𝐫 𝐀𝐩𝐩𝐬
𝐔𝐧𝐥𝐨𝐜𝐤 𝐭𝐡𝐞 𝐌𝐚𝐠𝐢𝐜 𝐨𝐟 𝐏𝐨𝐰𝐞𝐫 𝐁𝐈 𝐚𝐧𝐝 𝐏𝐨𝐰𝐞𝐫 𝐀𝐩𝐩𝐬: 𝐋𝐞𝐚𝐫𝐧 𝐇𝐨𝐰 𝐭𝐨 𝐄𝐚𝐬𝐢𝐥𝐲 𝐅𝐢𝐥𝐭𝐞𝐫 𝐚...
Vijay Perepa
May 20, 20231 min read
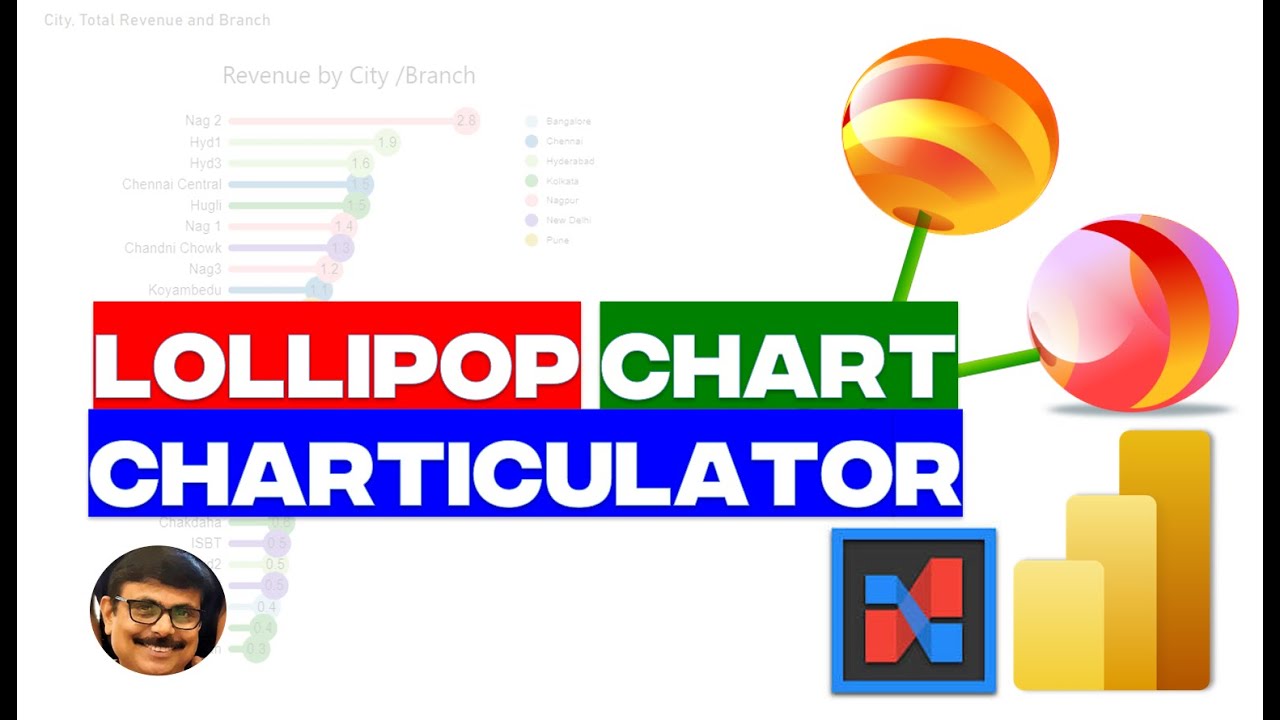
𝐇𝐨𝐰 𝐭𝐨 𝐂𝐫𝐞𝐚𝐭𝐞 𝐋𝐨𝐥𝐥𝐢𝐩𝐨𝐩 𝐂𝐡𝐚𝐫𝐭 𝐢𝐧 𝐏𝐨𝐰𝐞𝐫 𝐁𝐈
Creating Lollipop Chart in Power is just few click away!! Charticulator visual provides easy to use Templates to create such custom...
Vijay Perepa
Nov 11, 20221 min read

Different Date formats in Same Column
When you get data with multiple date formats in same column, it may result errors while transforming the Data. I have noticed that many...
Vijay Perepa
Oct 18, 20221 min read
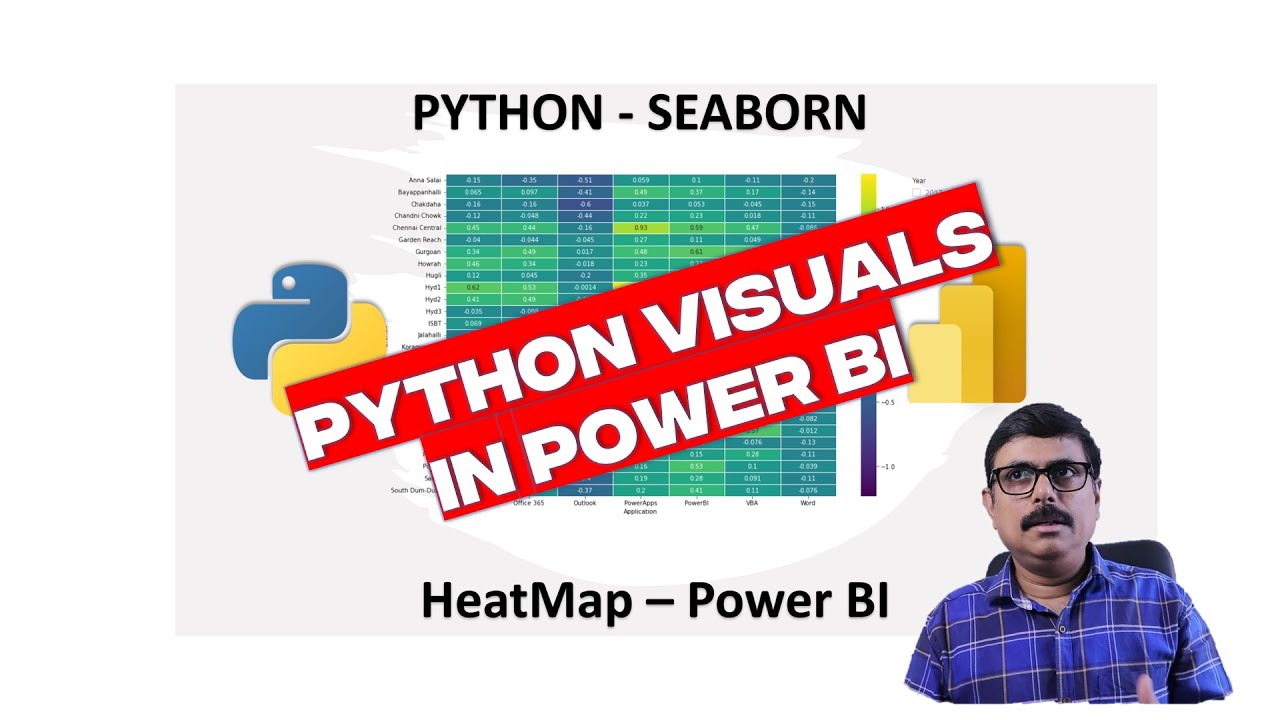
𝐏𝐨𝐰𝐞𝐫 𝐁𝐈 || 𝐏𝐲𝐭𝐡𝐨𝐧 || 𝐒𝐞𝐚𝐛𝐨𝐫𝐧 || 𝐇𝐞𝐚𝐭𝐦𝐚𝐩 || 𝐂𝐮𝐬𝐭𝐨𝐦 𝐕𝐢𝐬𝐮𝐚𝐥𝐬
You can create custom visuals in Power BI Desktop / Service by using Python packages very easily . I am coming up more videos to explain...
Vijay Perepa
Mar 21, 20221 min read
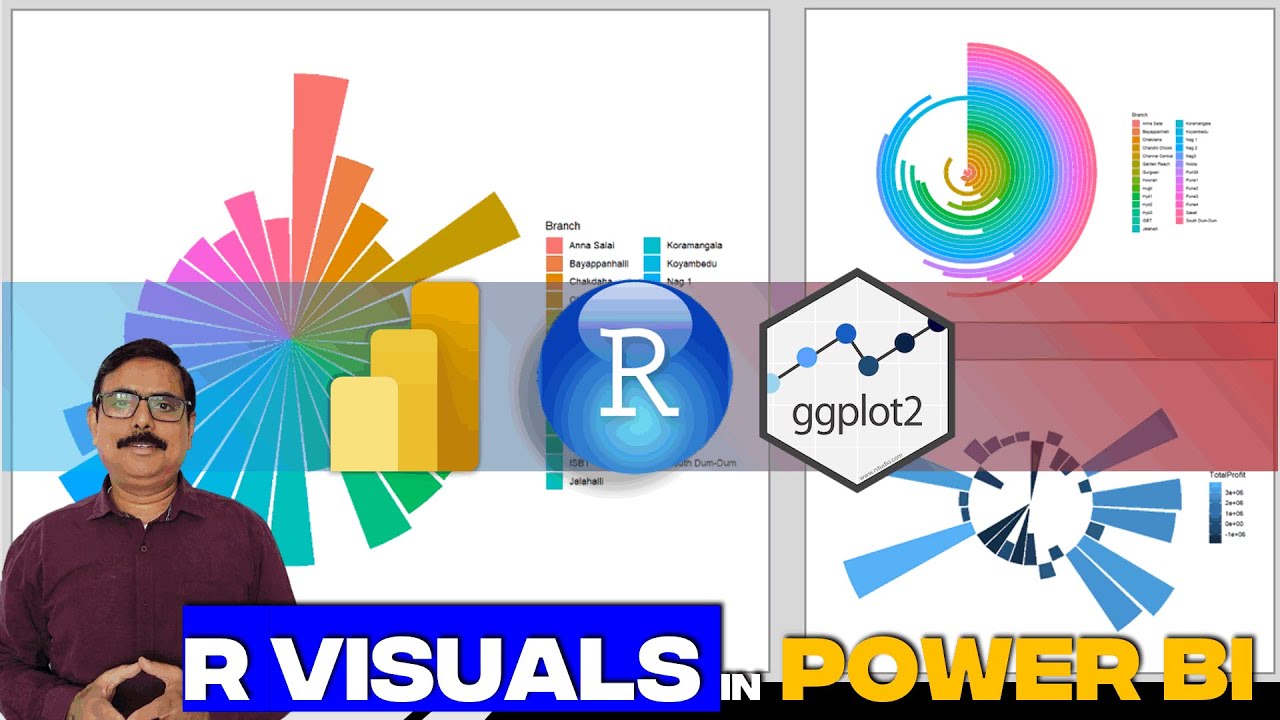
𝐂𝐢𝐫𝐜𝐥𝐞 𝐏𝐨𝐥𝐚𝐫 𝐕𝐢𝐬𝐮𝐚𝐥𝐬 𝐢𝐧 𝐏𝐨𝐰𝐞𝐫 𝐁𝐈 𝐮𝐬𝐢𝐧𝐠 𝐑 𝐕𝐢𝐬𝐮𝐚𝐥𝐬
Tried using Polar Char in place of Pie/Donut Chart to show case the data of multiple variables. Pie / Donut don't support both positive...
Vijay Perepa
Aug 11, 20211 min read

Know All Functions in Power Query ( M Language)
Get the complete list of Functions available in M Language with small step. Coming up with a new series of Videos . To get notified...
Vijay Perepa
Apr 21, 20211 min read


𝗔𝗴𝗲𝗶𝗻𝗴 𝗔𝗻𝗮𝗹𝘆𝘀𝗶𝘀 𝗶𝗻 𝗣𝗼𝘄𝗲𝗿 𝗕𝗜
https://community.powerbi.com/t5/Data-Stories-Gallery/Ageing-Analysis-in-Power-BI/m-p/1645585#M5006 #powerbi #powerbisupport...
Vijay Perepa
Feb 4, 20211 min read
bottom of page