top of page

Create account
+91 96113 44773
Search


𝐇𝐨𝐰 𝐭𝐨 𝐂𝐫𝐞𝐚𝐭𝐞 𝐚 𝐌𝐚𝐭𝐫𝐢𝐱𝐓𝐚𝐛𝐥𝐞 𝐰𝐢𝐭𝐡 𝐒𝐩𝐚𝐫𝐤𝐥𝐢𝐧𝐞 𝐢𝐧 𝐏𝐨𝐰𝐞𝐫 𝐁𝐈
Creating a Table Visual with Sparkline in Power BI like we can do in Excel Some times Simple workaround makes the reporting much...

Vijay Perepa
Feb 12, 20211 min read

𝐌𝐚𝐧𝐚𝐠𝐢𝐧𝐠 𝐃𝐲𝐧𝐚𝐦𝐢𝐜 (𝐢𝐧𝐜𝐨𝐧𝐬𝐢𝐬𝐭𝐞𝐧𝐭) 𝐅𝐢𝐥𝐞𝐬 𝐍𝐚𝐦𝐞𝐬 𝐨𝐟 𝐃𝐚𝐭𝐚𝐬𝐞𝐭
While dealing with Excel/CSV Files as Source Data for Power BI Report, you may face a common problem inconsistent Names of Files and even...
Vijay Perepa
Feb 10, 20211 min read


𝗔𝗴𝗲𝗶𝗻𝗴 𝗔𝗻𝗮𝗹𝘆𝘀𝗶𝘀 𝗶𝗻 𝗣𝗼𝘄𝗲𝗿 𝗕𝗜
https://community.powerbi.com/t5/Data-Stories-Gallery/Ageing-Analysis-in-Power-BI/m-p/1645585#M5006 #powerbi #powerbisupport...
Vijay Perepa
Feb 4, 20211 min read

Waffle Chart - Excel for beginners
Learning Excel is Quite interesting when you are learning in a right direction. Using Conditional and few custom options available in...
Vijay Perepa
Feb 3, 20211 min read

Excel Basics for Beginners
Started a series of Videos for Beginners . Follow the blog get the more tips and Tricks on Excel
Vijay Perepa
Feb 2, 20211 min read

Excel Formulas - CHOOSE - To create interactive Chart
To Create any Advanced chart you need to know few basic Excel Formulas and with clear understanding about the outcome, which can result a...
Vijay Perepa
Jan 31, 20211 min read
Interactive Excel Chart in 5 Minutes
Creating Reports with Excel Charts is quite Easy and Effective. Whenever we create a Chart in Excel we need to keep in view of the end...
Vijay Perepa
Jan 26, 20211 min read
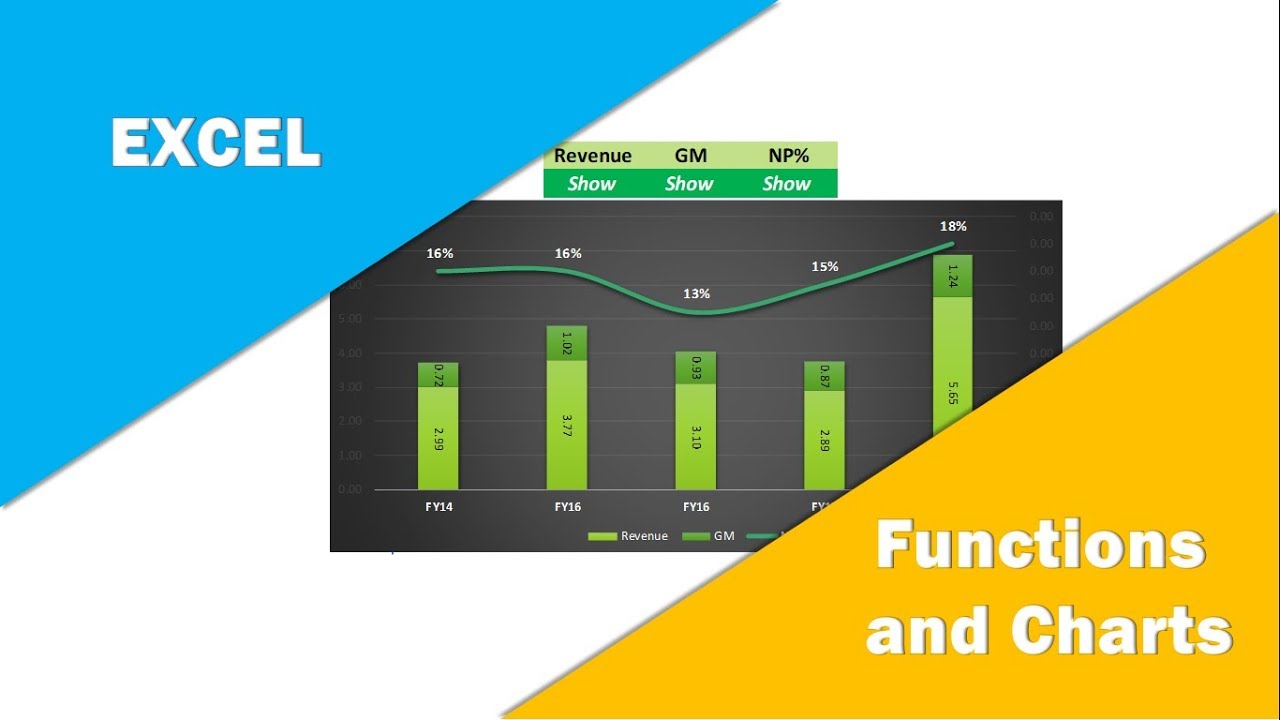
Simple IF Function, Data Validation, Conditional Formatting to get a Quick Dynamic Report (Chart)
Some times, you can use simple basics of Excel to show best results and within no time. In this video I have explained how to use...
Vijay Perepa
Jan 24, 20211 min read
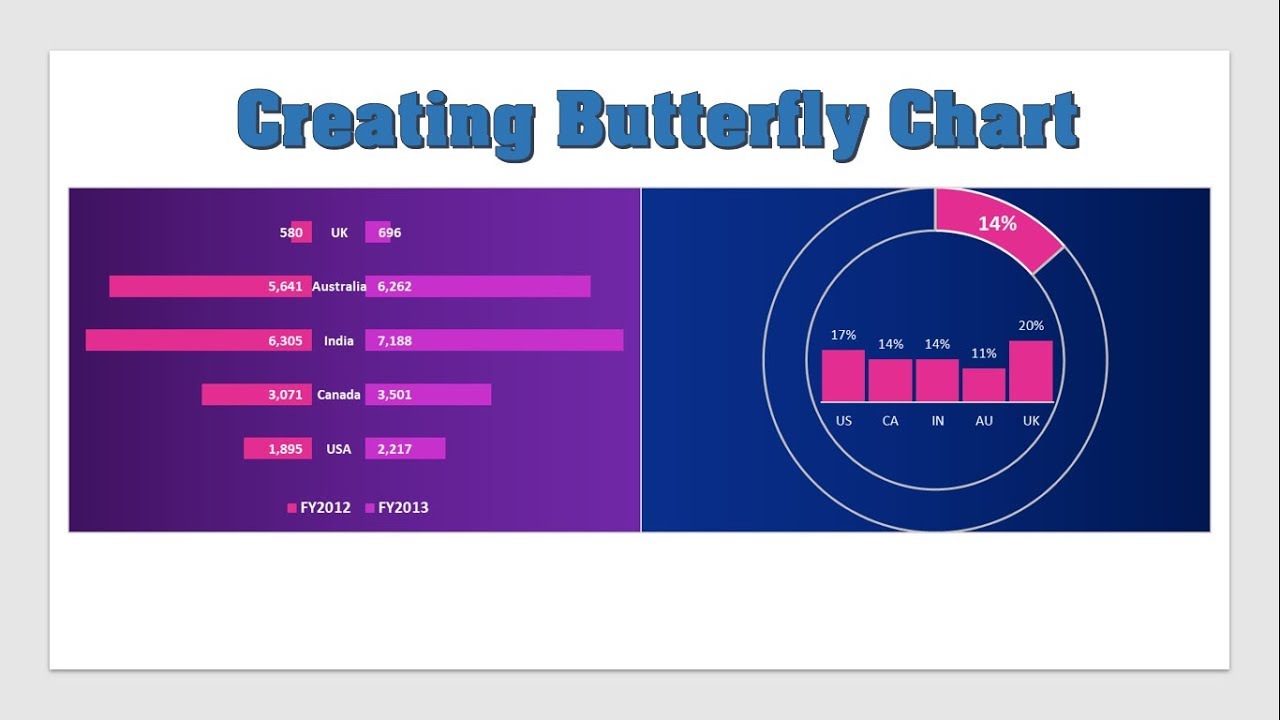
How to Create Butterfly Chart (Also called as Tornado, Pyramid Chart)
Telling a Data Story with Visualization in Excel much is quite interesting. Watch this video to understand how to achieve that in just 15...
Vijay Perepa
Jan 23, 20211 min read
Vijay Perepa
Jan 22, 20210 min read
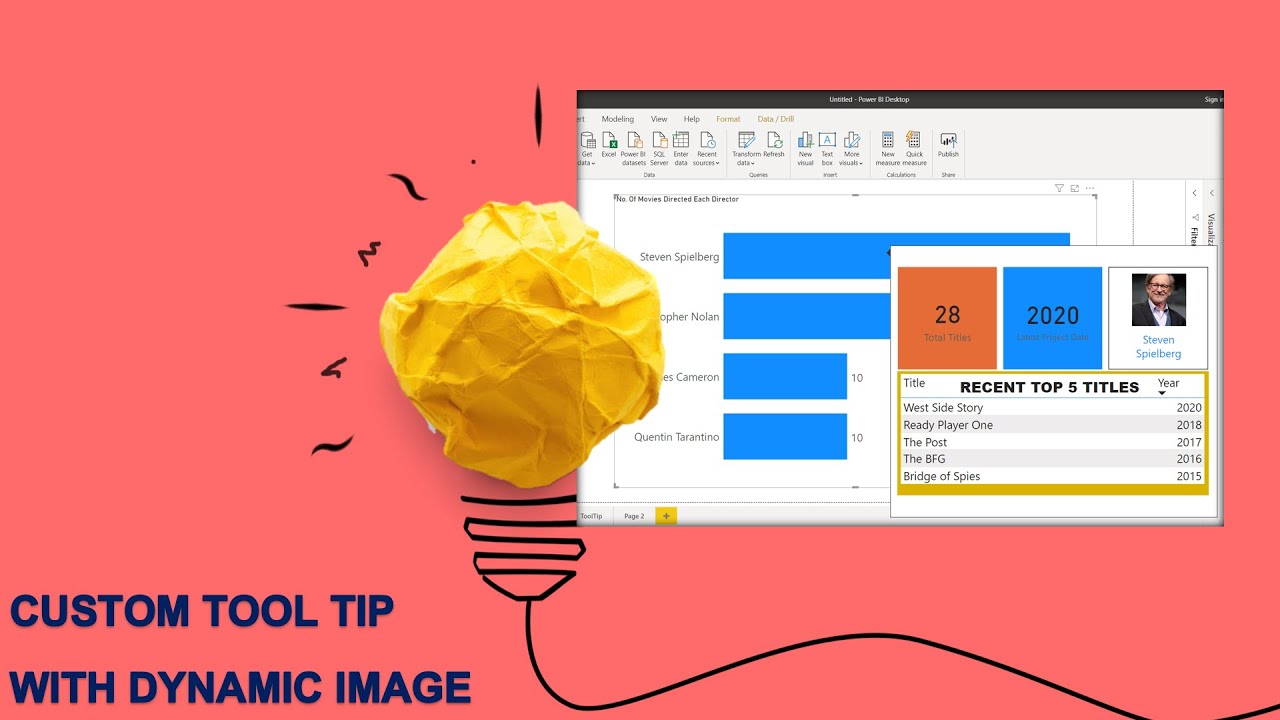
Customized Tool-tip in Power BI || Create Custom Tool-tip with Dynamic Image on Mouse Hover
IF you have below Questions - What is Tooltip in Power BI - How to change background color of tooltip in Power BI - How to show chart on...
Vijay Perepa
Jan 9, 20211 min read

Reporting TIPS in PowerBI : More With Book Marks in PowerBI
Creating Simple Reports with Power BI and make your Teams feel WoW!!
Vijay Perepa
Jan 7, 20211 min read
Import Power Pivot model to Power BI
If you have already created a Data Model in PowerPivot and if you wish to migrate to Power Bi , it is just easy! Watch this Video to know...
Vijay Perepa
Jan 7, 20211 min read

Learn VBA in PowerPoint New Series Part 1
You might be knowing how to use Excel Macros easily because in Excel Macros you can record a Macro easily. But in case of PowerPoint you...
Vijay Perepa
Jan 6, 20211 min read


Power BI - Filters on this Page - Avoid Filtering specific visual when page level filter is on!
In Power BI, To Filter the Data Externally you can find Filters Pane where you have 3 different options as shown in the below picture:...
Vijay Perepa
Jan 6, 20211 min read

Creating real 3D Text in After Effects in Seconds
Welcome to my new Channel - PerepaEdu - VFX I am going to teach you VFX , 3D modelling and many more. How to create real 3D Text in After...
Vijay Perepa
Jan 3, 20211 min read
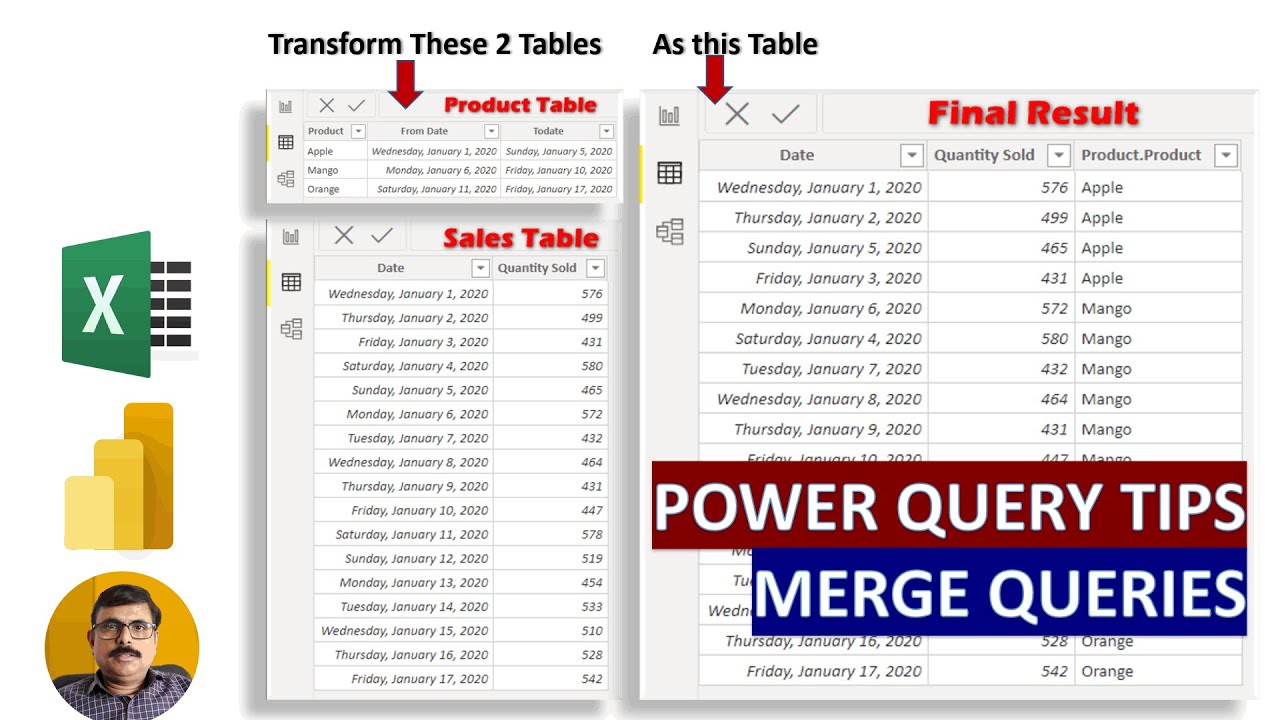
Power Query Editor Tips & Tricks
While performing ETL understanding the data behavior is important. Also need to know which feature helps us to do better transformation...
Vijay Perepa
Dec 31, 20201 min read

Hide or Un-hide sheets based on selection using VBA in Excel
This is a most common question asked across the Groups. How to Hide or Unhide Sheets based on Selection. There are two ways 1 .by...
Vijay Perepa
Dec 20, 20201 min read

Vijay Perepa
Dec 15, 20200 min read
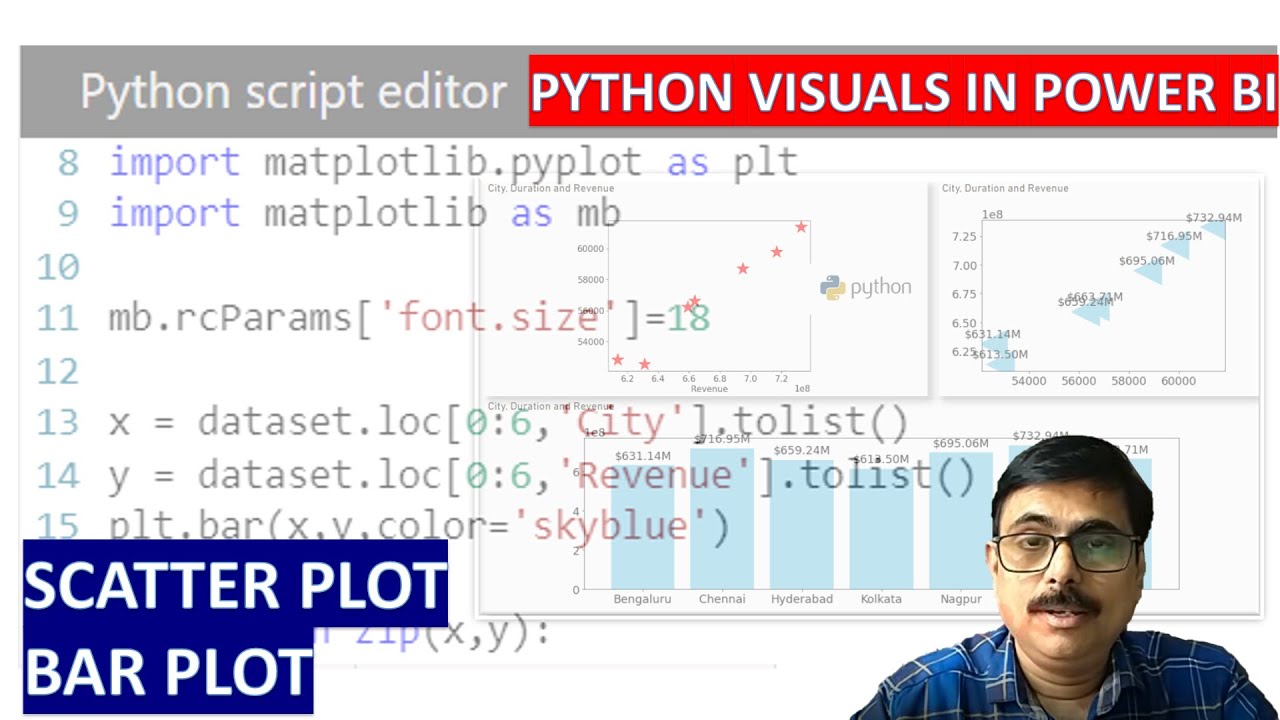
𝐒𝐜𝐚𝐭𝐭𝐞𝐫 𝐏𝐥𝐨𝐭 𝐚𝐧𝐝 𝐁𝐚𝐫 𝐏𝐥𝐨𝐭 𝐏𝐲𝐭𝐡𝐨𝐧 𝐕𝐢𝐬𝐮𝐚𝐥𝐬 𝐢𝐧 𝐏𝐨𝐰𝐞𝐫 𝐁𝐈 𝐏
In this video you will learn : - Adding Scatter Plot , Bar Plot - Adding Data Labels using For Loop and Zip Function - Few important...
Vijay Perepa
Dec 14, 20201 min read
bottom of page