top of page

Create account
+91 96113 44773
Search
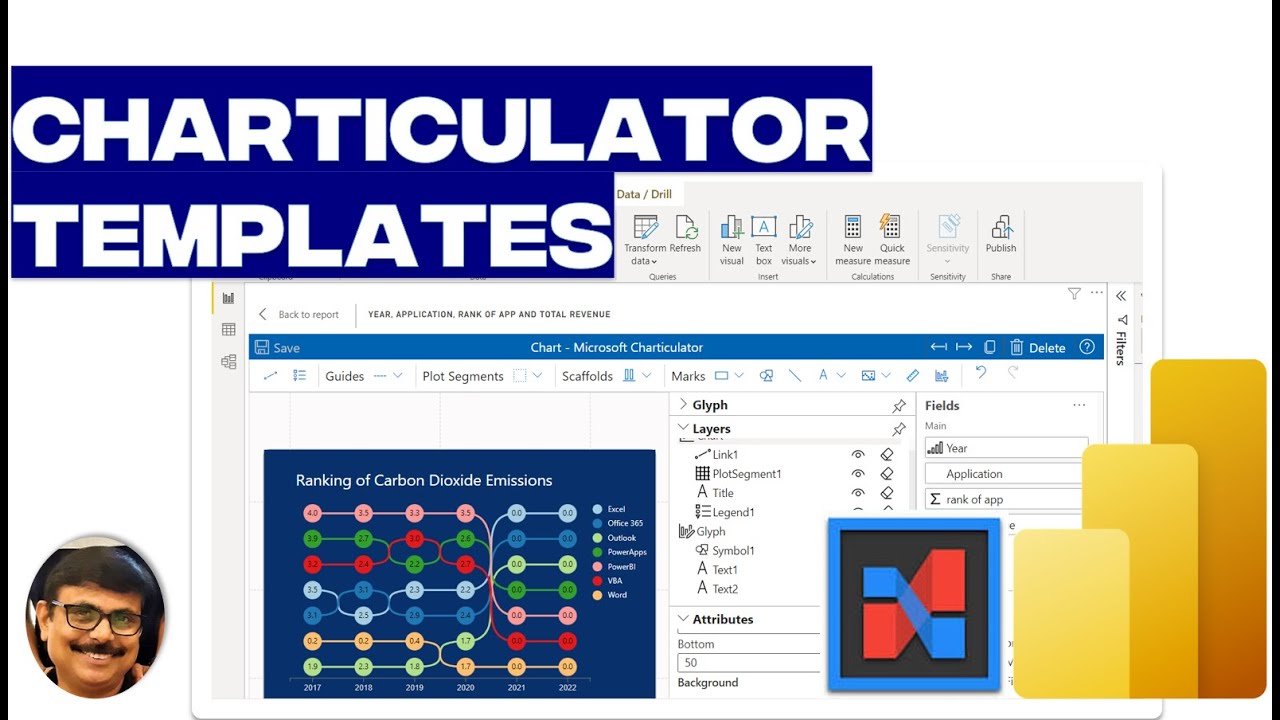
Charticulator Templates
Charticulator a best Visual available from the market place - Power BI You can create many tailor-made visuals and if you wish you can...

Vijay Perepa
Nov 10, 20221 min read

Different Date formats in Same Column
When you get data with multiple date formats in same column, it may result errors while transforming the Data. I have noticed that many...
Vijay Perepa
Oct 18, 20221 min read

Cloud Flow with AI
Create a Cloud Flow using Description , Use your words and turn them to a cloud flow , now available as preview documentation Watch this...
Vijay Perepa
Oct 15, 20221 min read
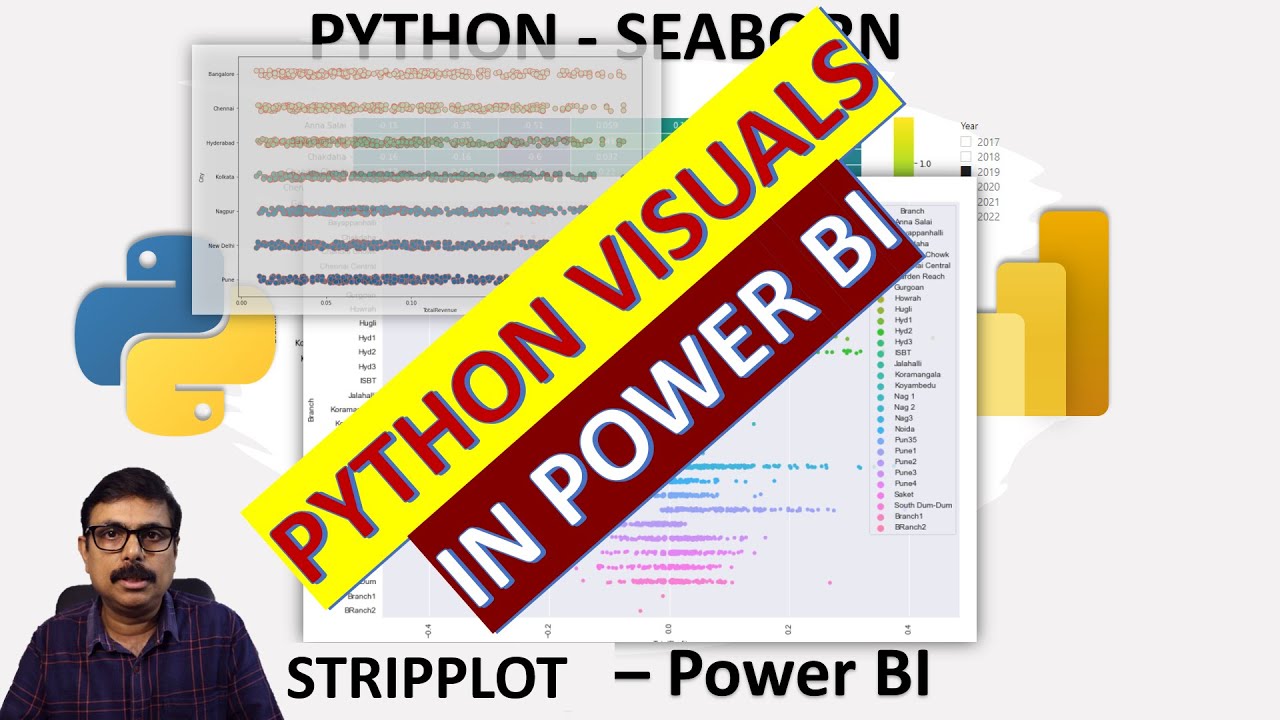
Power BI || Python || Seaborn || strip plot || Custom Visuals in Power BI 3
#powerbi#python#stripplot strip plot in seaborn When you are using regular scatterplot with data value it shows the Bubbles on either x...
Vijay Perepa
Mar 31, 20221 min read
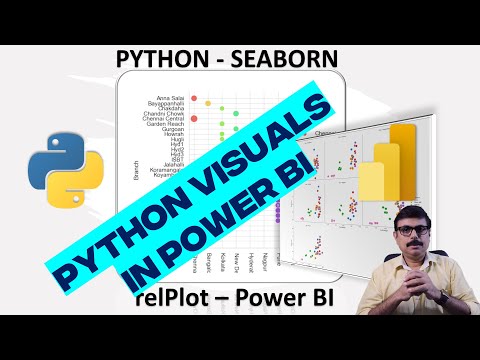
Power BI || Python || Seaborn || relplot || Custom Visuals in Power BI 2 ||
relplot means relational plot , which shows the relations between two variables like the basic scatterplot (which is part of default...
Vijay Perepa
Mar 27, 20221 min read
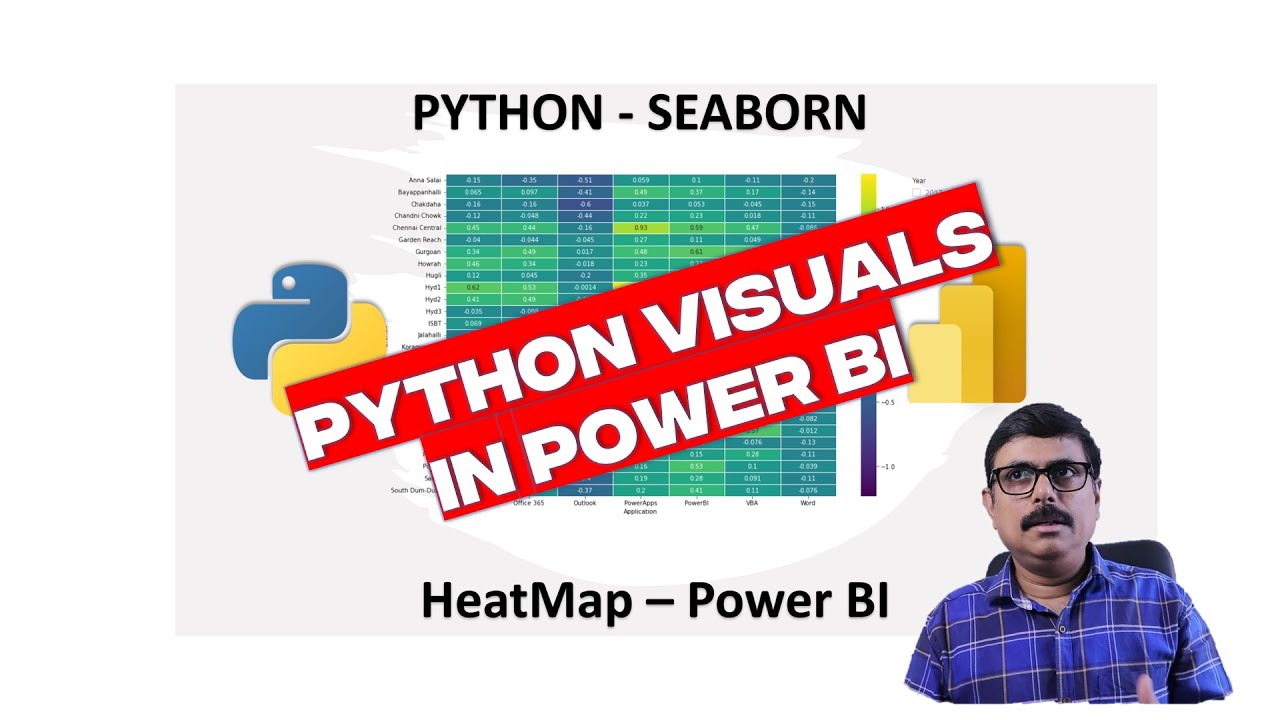
𝐏𝐨𝐰𝐞𝐫 𝐁𝐈 || 𝐏𝐲𝐭𝐡𝐨𝐧 || 𝐒𝐞𝐚𝐛𝐨𝐫𝐧 || 𝐇𝐞𝐚𝐭𝐦𝐚𝐩 || 𝐂𝐮𝐬𝐭𝐨𝐦 𝐕𝐢𝐬𝐮𝐚𝐥𝐬
You can create custom visuals in Power BI Desktop / Service by using Python packages very easily . I am coming up more videos to explain...
Vijay Perepa
Mar 21, 20221 min read

𝐏𝐨𝐰𝐞𝐫 𝐐𝐮𝐞𝐫𝐲 𝐚𝐧𝐝 𝐇𝐨𝐰 𝐭𝐨 𝐌𝐚𝐧𝐚𝐠𝐞 𝐃𝐚𝐭𝐞𝐬 𝐢𝐧 𝐓𝐞𝐱𝐭 𝐅𝐨𝐫𝐦𝐚𝐭 - 𝐌 𝐋
When you have Data with Dates (🅽🅾🆃 🆁🅴🅰🅻🅻🆈 🅳🅰🆃🅴🆂) in the form of Text , and you wanted to have Time Intelligence...
Vijay Perepa
Feb 25, 20221 min read
𝐏𝐨𝐰𝐞𝐫 𝐁𝐈 𝐚𝐧𝐝 𝐄𝐱𝐜𝐞𝐥 - 𝐃𝐚𝐭𝐞 𝐓𝐢𝐩 - 23 Feb 2022
𝐅𝐢𝐧𝐝𝐢𝐧𝐠 𝐃𝐚𝐭𝐞 𝐟𝐫𝐨𝐦 𝐃𝐚𝐲 𝐨𝐟 𝐭𝐡𝐞 𝐘𝐞𝐚𝐫 𝐢𝐧 𝐄𝐱𝐜𝐞𝐥 𝐰𝐢𝐭𝐡 𝐅𝐨𝐫𝐦𝐮𝐥𝐚 & 𝐢𝐧 𝐏𝐨𝐰𝐞𝐫 𝐁𝐈 𝐮𝐬𝐢𝐧𝐠...
Vijay Perepa
Feb 23, 20221 min read

PowerApps-Power Automate-Power BI - Tutorial
IF you are a beginner and wish to create a nice app , This video may help you!! We have tried best to keep most of the topics of...
Vijay Perepa
Feb 14, 20221 min read

Power Platform - Tutorial will be posted shortly
Integration PowerApps with power bi and Power Automate.
Vijay Perepa
Feb 10, 20221 min read
Vijay Perepa
Dec 21, 20210 min read
Vijay Perepa
Dec 12, 20210 min read
Vijay Perepa
Dec 1, 20210 min read
New Format Pane for Page and Visuals 📊
Power BI - Nov 2021 Updates New Format Pane for Page and Visuals 📊 Also you can use Bold / Italic / Underline ! (Same as Excel ,...
Vijay Perepa
Nov 22, 20211 min read
𝐏𝐨𝐰𝐞𝐫 𝐁𝐈 - 𝐍𝐨𝐯 𝟐𝟎𝟐𝟏 𝐔𝐩𝐝𝐚𝐭𝐞𝐬 - 𝐏𝐚𝐠𝐞𝐍𝐚𝐯𝐢𝐠𝐚𝐭𝐢𝐨𝐧
Power - BI Nov 2021 Update brought many more best features . I will sharing most of the features thru small videos to get better idea....
Vijay Perepa
Nov 18, 20211 min read
Let's Compare Power Query Functions and Excel Formulae
Comparison of Text Formulas in Excel and in Power Query
Vijay Perepa
Nov 13, 20211 min read


R Simple Plotting
R (Simple) Plot #rlanguage #perepaedu#learning
Vijay Perepa
Nov 7, 20211 min read


Let's hae very basic understanding of SQL
What is Schema Object? The Schema Object where the SQL Data is stored There are 12 Types of Schema Object 1. Base Table 2. View 3. Domain...
Vijay Perepa
Nov 3, 20211 min read
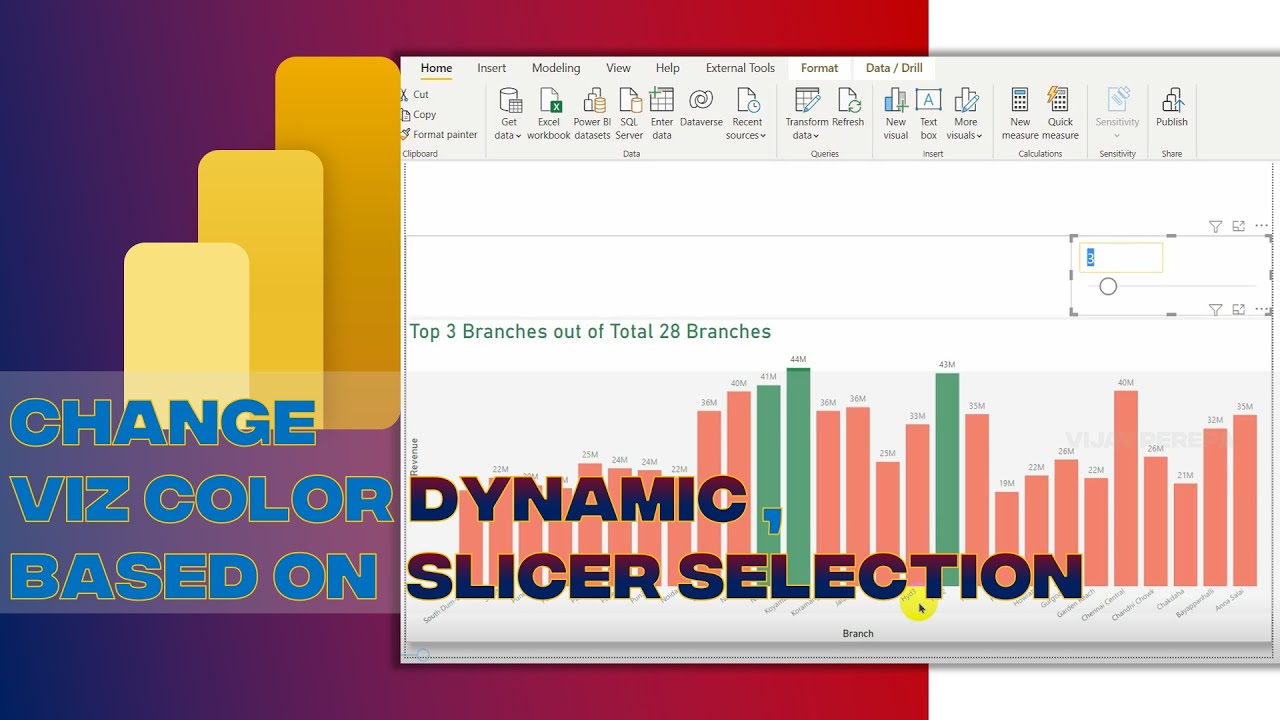
𝐏𝐨𝐰𝐞𝐫 𝐁𝐈 𝐃𝐲𝐧𝐚𝐦𝐢𝐜 𝐂𝐨𝐥𝐨𝐫 𝐂𝐡𝐚𝐧𝐠𝐞 𝐢𝐧 𝐕𝐢𝐬𝐮𝐚𝐥𝐬 𝐰𝐢𝐭𝐡 𝐬𝐥𝐢𝐜𝐞𝐫
This is a known tip to many, but beginners of Power BI , this must be a useful tip. Step 1 - Create a Clustered Column Chart Step 2 -...
Vijay Perepa
Oct 24, 20211 min read
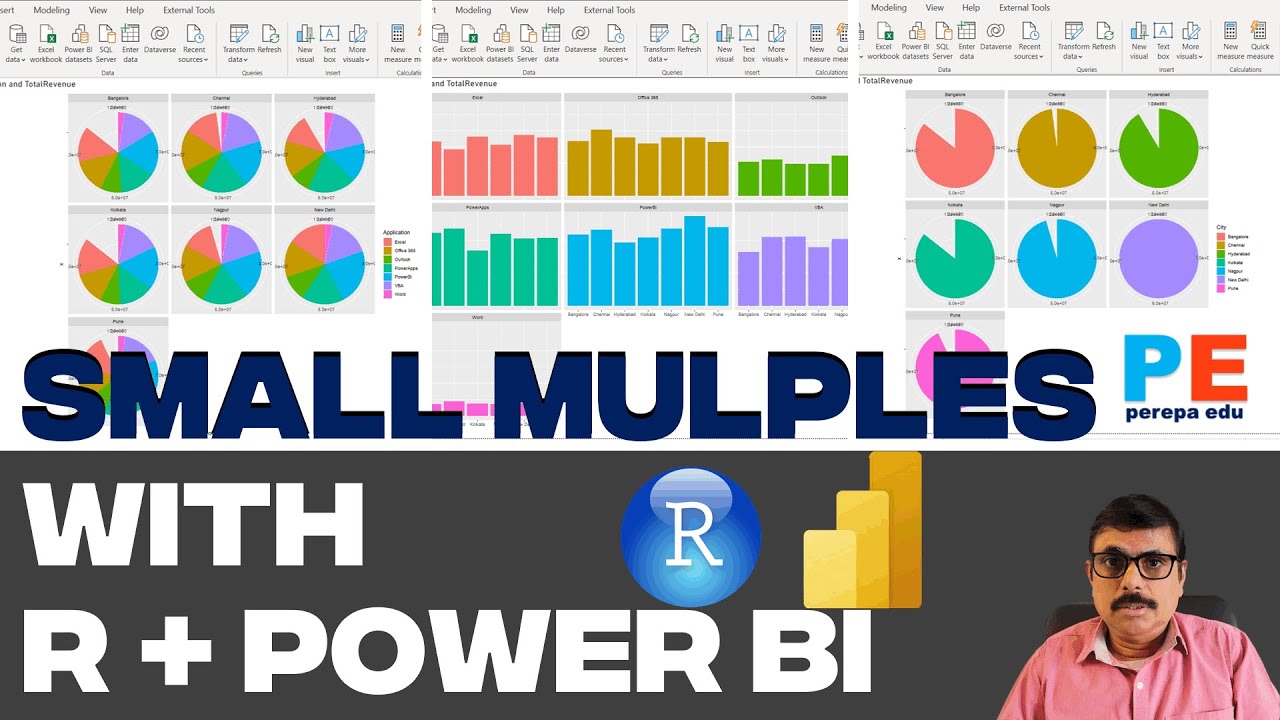
𝐒𝐦𝐚𝐥𝐥 𝐌𝐮𝐥𝐭𝐢𝐩𝐥𝐞𝐬 - 𝐏𝐢𝐞 𝐂𝐡𝐚𝐫𝐭 - 𝐑 & 𝐏𝐨𝐰𝐞𝐫 𝐁𝐈
While using small multiples Feature in Power BI , one thing you may notice that you cannot have Small Multiples for PIE . To get small...
Vijay Perepa
Oct 17, 20211 min read
bottom of page